Personal GrADS Tips
I love GrADS, and I'm always learning new tips and tricks. Here are some of the ones that I have figured out, and that may be difficult to find elsewhere on the web.
The files on this page may get moved from server to server...always check this page for the correct link.
General control file information
Since I use PC-GrADS...that is, on a Windows machine...I've realized that control (.ctl) files must be in Unix format. No
carriage returns, which are added to files in Notepad and most other text editors. I recommend Metapad,
which allows you to toggle between formats.
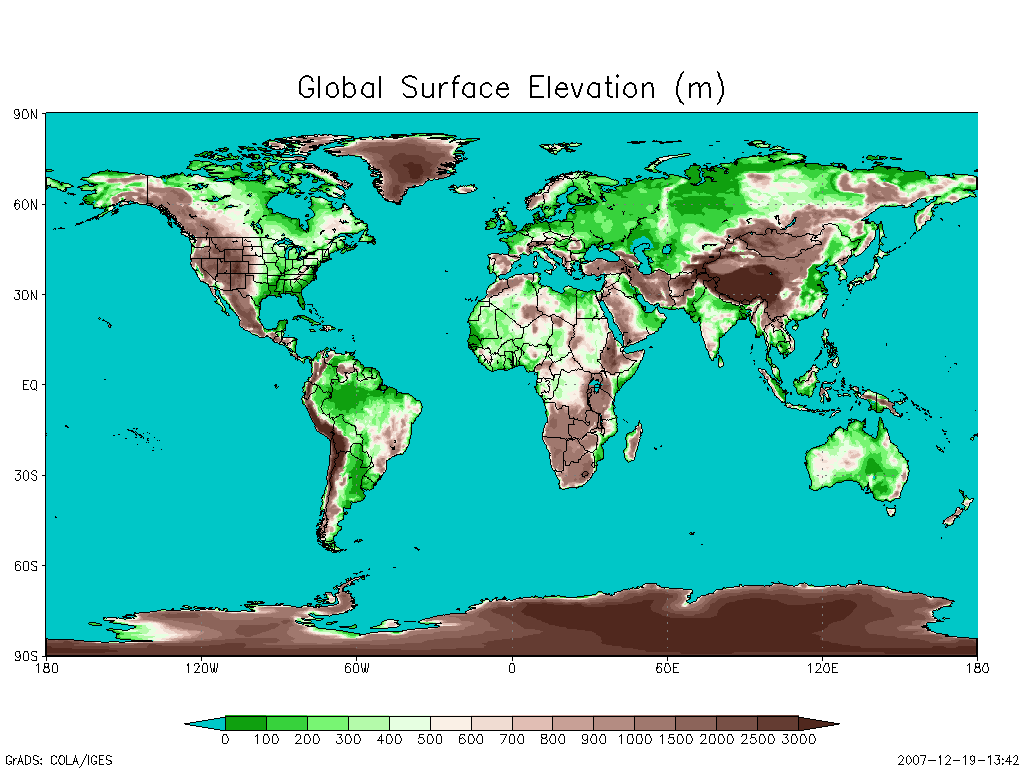
Elevation Data
Sometimes, I like to have a nice display of elevation beneath contours. For this, there are two options:
- Global terrain data at 0.5 degree resolution
- CONUS/Canada terrain at ~12 km resolution
If you use this data, I would like to know...please email me. Thanks!
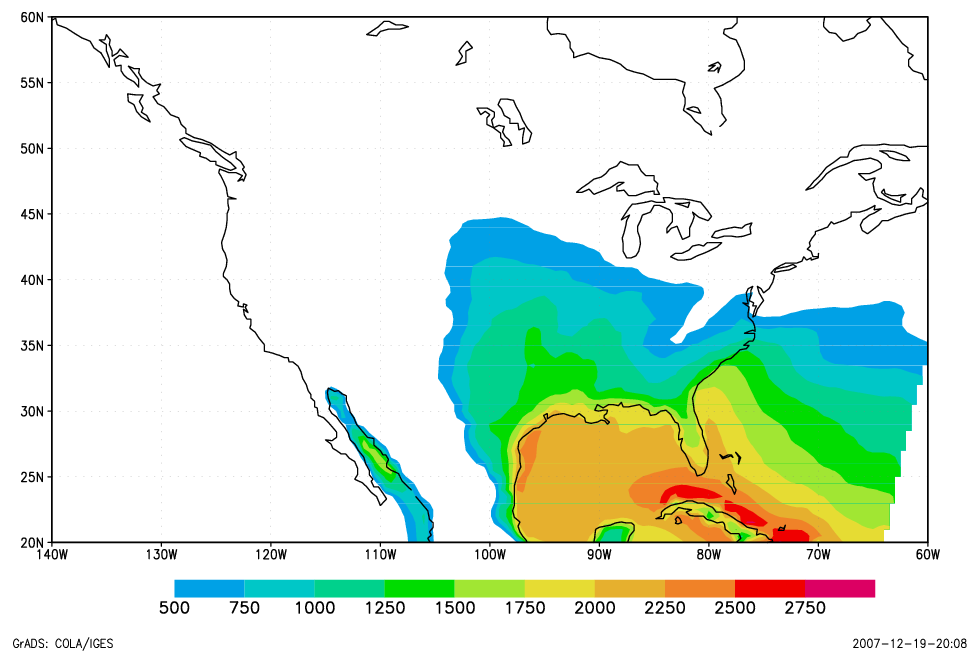
Map Projections
In the regional terrain map above, the map projection is not a strict latitude-longitude grid. To create more realistic projections:
set mproj nps
set mpvals -120 -70 25 55
You'll have to play with the settings on mpvals, but those are good starting points for a CONUS map. Also, make sure your data domain (set lat and set lon) will spread over the entire map.
Note that mine doesn't--the 218 grid doesn't quite cover all of Nova Scotia (far NE of the map).
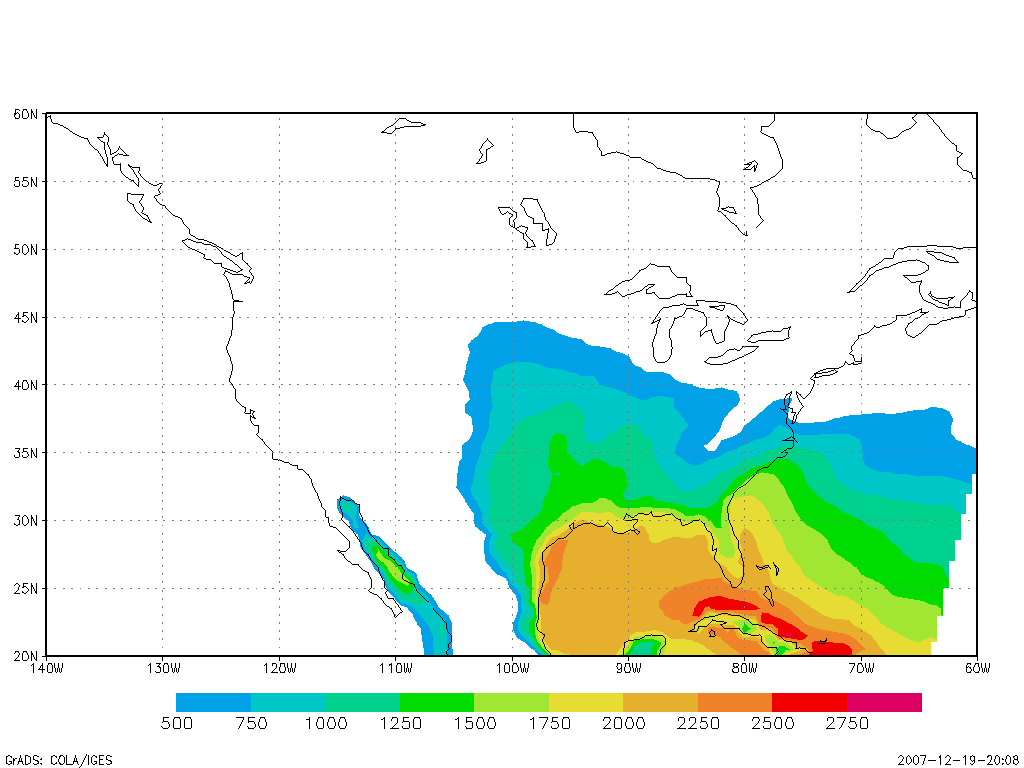
Land-Water Mask
Also in the maps above, I have masked all water bodies with a light blue. To do this, you
will need basemap.gs from the GrADS Script Library.
Also get all of the .asc files shown on that line, too.
I use PCGrADS (i.e., on a Windows machine), and have found that while I can leave basemap.gs
in the PCGrADS/lib directory, the .asc files need to be in my current directory. I'm not
sure if this will be true for you.
Once all the files are in place, I do something like this:
set mpdset mres
set mpdraw on
set gxout shaded
d hgtsfc
basemap o 5 1 m
The basemap script is well-documented, and explains the commands I have used here.
Extra Colors
Retrieve define_colors.gs from the GrADS Script Library for a whole host of
extra colors (including the ones in the terrain maps above).
Interpolation between levels
Complicated and slow. More information, including code, coming soon.
Lines in Postscript files
When enable print and gxps are used to create images, the resulting PS file will also have tacky looking lines if it
involves filled contours, thanks to the algorithm. Using printim does NOT cause lines.
The lines appear:
almost always when the PS or EPS file is displayed on the screen
if ImageMagick's convert is used to create a gif, jpg, or png file
when the file is embedded in a PDF
The lines do NOT appear:
when the PS or EPS image is imported into Microsoft Office XP
when the PS or EPS image is printed, either by lpr or embedded in a Word/Powerpoint file
So, to summarize, the lines are annoying and ugly, but unless you use ImageMagick to force the conversion, they appear only on the screen
and not in print. To avoid permanent lines, create images (gif or png) using printim from the GrADS command line.
Example images: with lines and without lines.
Using GRIB-2 and GrADS (for now)
NCEP is exclusively distributing most of its products in GRIB-2 format now. GrADS
2.0 now supports the new format (and has a Windows executable). I haven't
upgraded on my machine yet. For those of you still running GrADS 1.8 or 1.9, and
want to ingest GRIB-2 files, you essentially have two options:
Convert the file to GRIB-1. I have not been able to compile NCEP's
conversion programs
using Cygwin, yet.
Using wgrib2,
dump the file to a binary file, and write the control file yourself. If any of the
records in the file are out of order, you will have problems, but I've never had this
happen in four years of working with NCEP model output. It's complicated, but it
does work. This is how my
maps are
produced.